Overview of the Dashboard Tab in Quickbooks Online
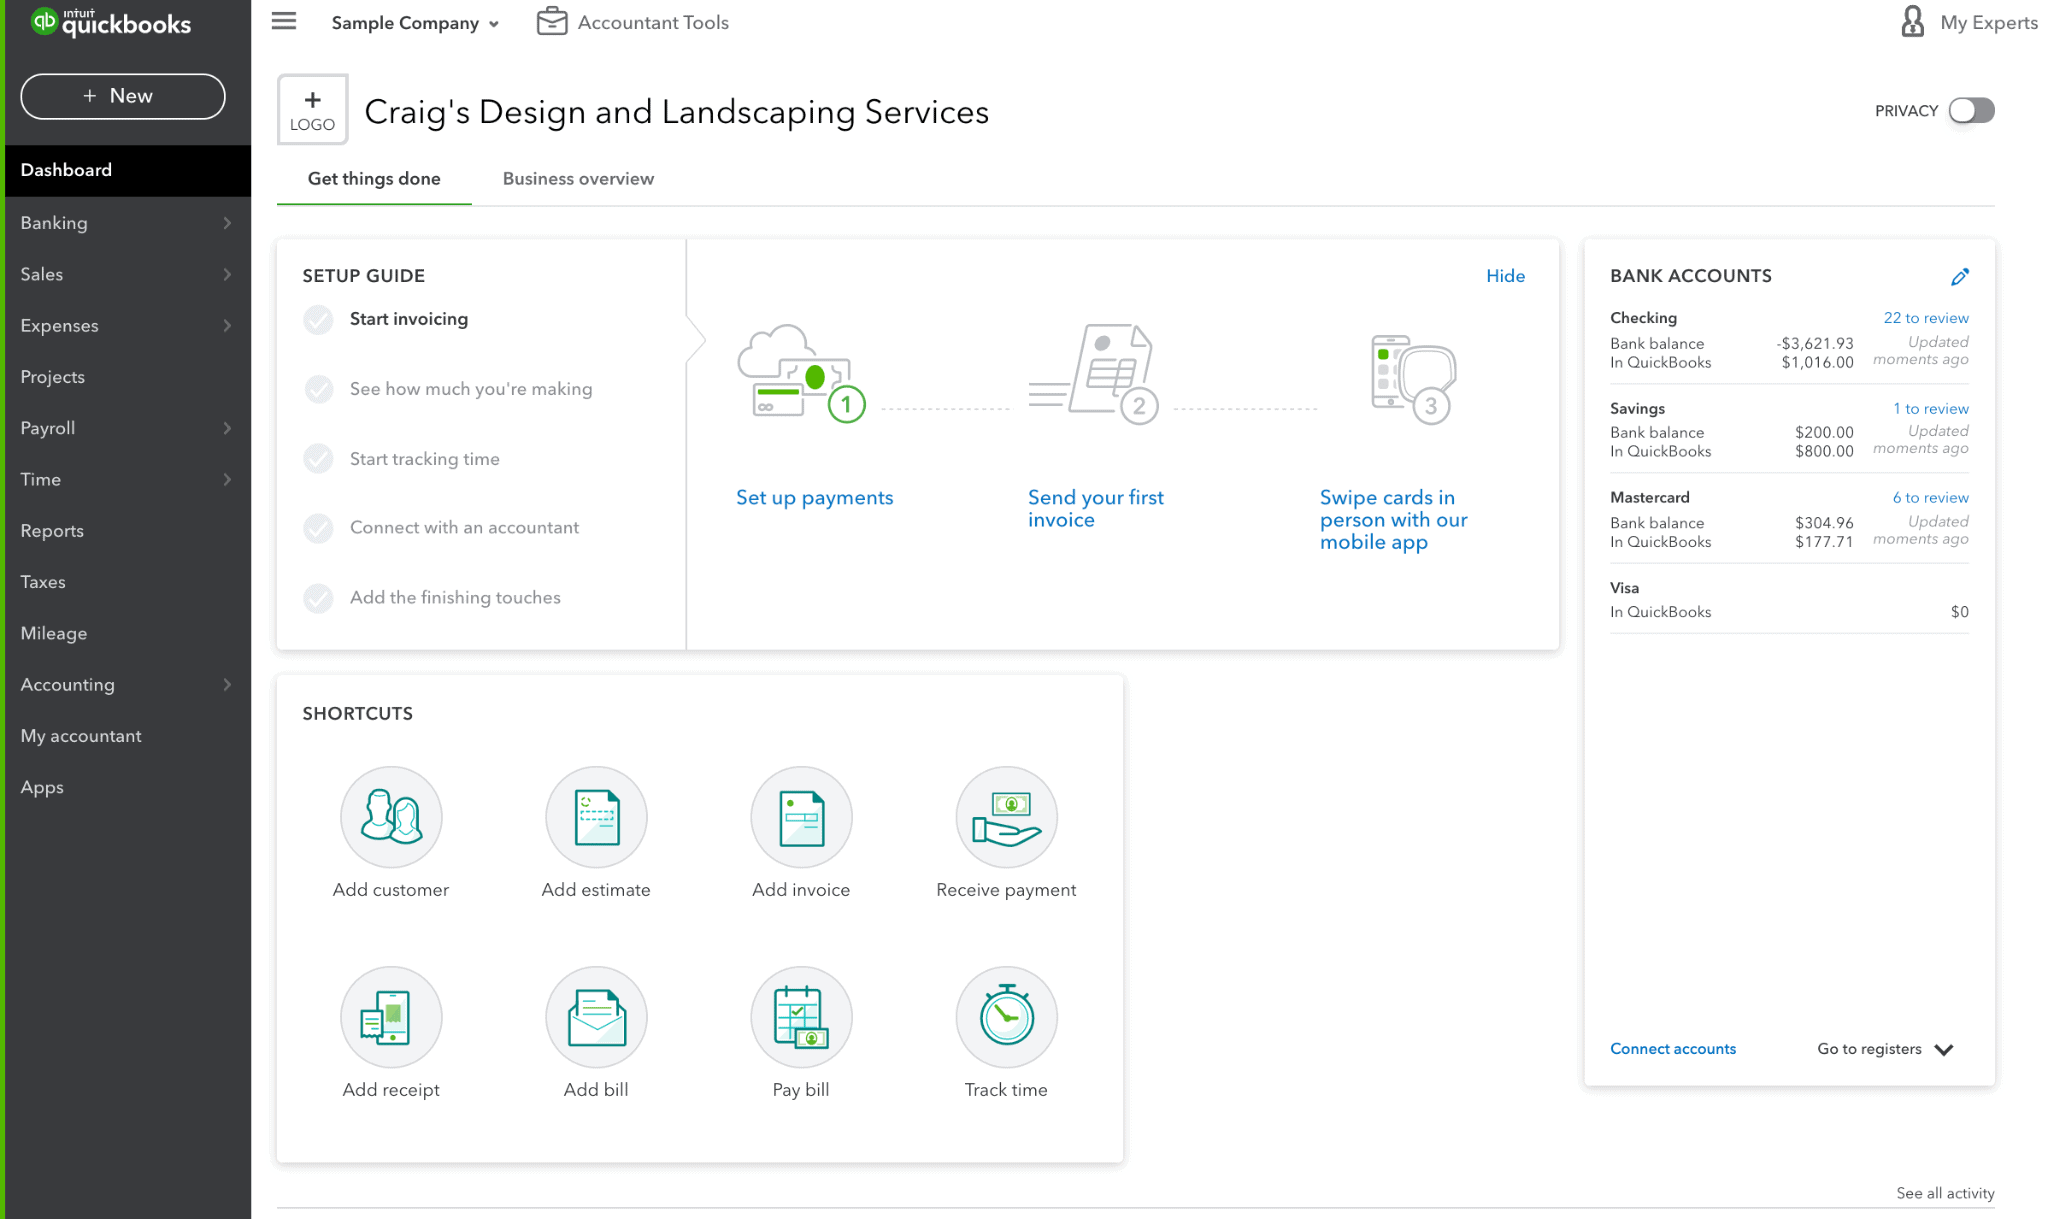
When first logging into Quickbooks, the below dashboard will appear.
Quickbooks Dashboard

This page includes shortcut access to certain features, such as adding a customer, adding a receipt, adding an estimate, adding a bill, adding an invoice, paying a bill, receiving payments, and tracking time. On the right, it also shows all bank accounts that are linked in Quickbooks as well as the number of transactions that have not yet been categorized and are open on the Banking tab. For example, for the checking account, there are 22 transactions that still need to be reviewed.
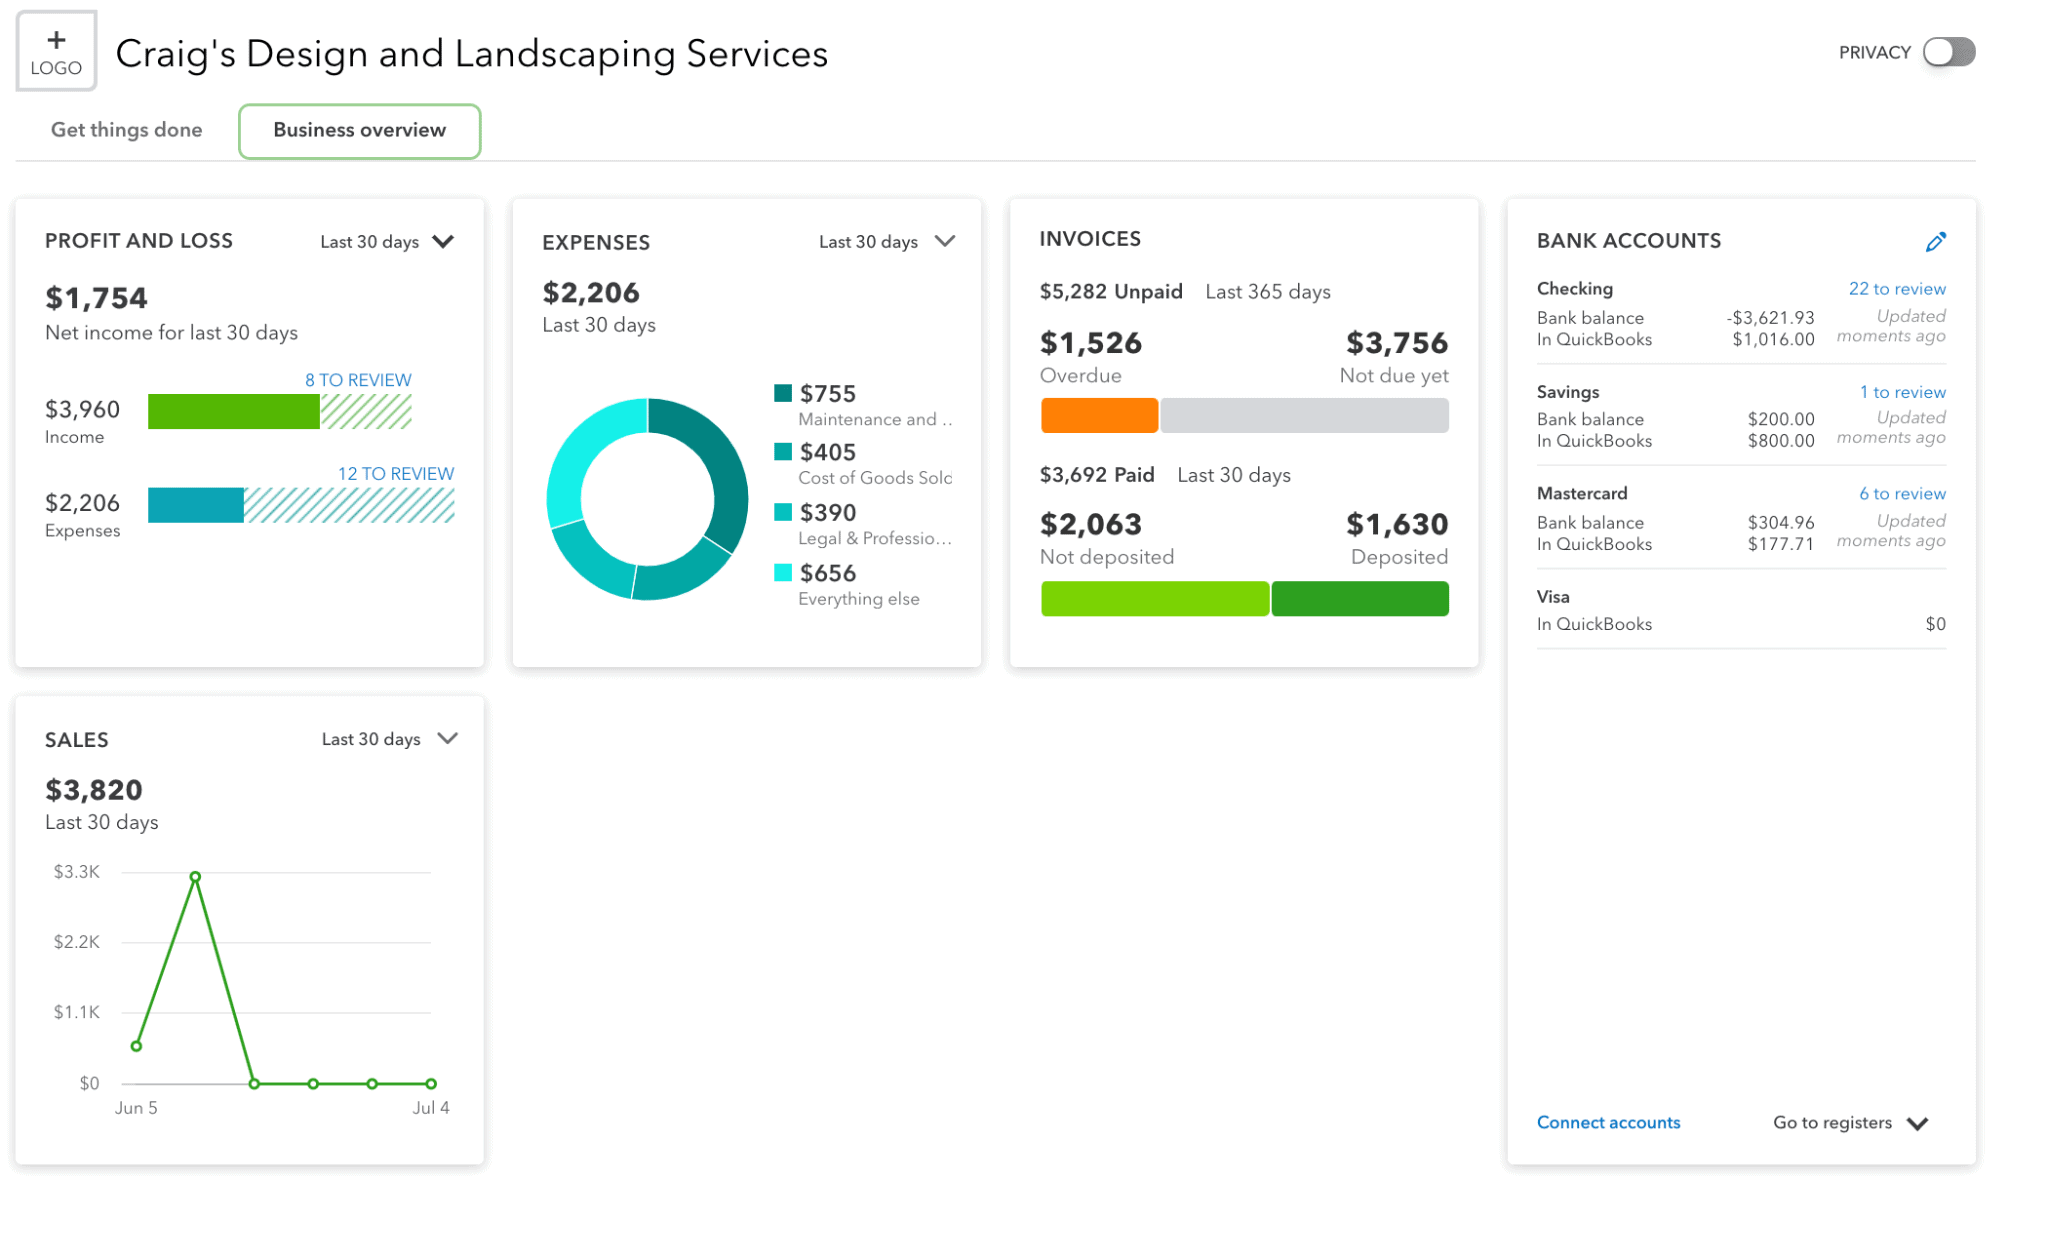
The business overview tab (to the right of the “Get things done” tab) shows graphs generated by Quickbooks that offer a better visual of the business.
Viewing the Business Overview Tab in QuickBooks

The first box shows the P&L as of the last 30 days, but this can be changed to other time periods if desired. There is also a graph for expenses, which includes the breakdown of expense categories. Here, we can see the greatest amount of expenses for this example company go to Maintenance & Repairs, Cost of Goods sold, and Legal/Professional fees. There is also information on invoices and a graph that shows the trend in sales. Here we can see a big dip in sales in the past few weeks. This may not have been as obvious without the graph, so looking at the Quickbooks dashboard every once and a while doesn’t hurt.


